Applied AI
AI implementations that get used.
AI does not change what good analytics work looks like. It changes how much it costs to skip the foundation. We build, transfer, and govern that foundation, then layer AI on top of it.
The Cascade POV
- 01
Foundations first.
Models are only as good as the data underneath.
- 02
Governance is the moat.
Tooling drifts within six months without it.
- 03
Push, not pull.
Decisions should arrive when needed, not wait to be found.
- 04
Augmentation, not replacement.
AI agents work alongside senior judgment.
- 05
Tool-agnostic by design.
No resale relationships. No platform debt.
A working example
What this looks like in real life.
One example: a pharmaceutical sales rep prepping for a high-stakes call. The data piles up fast – performance, message, network – and most of it never gets used.
Watch how composed AI rewrites the work behind the call. The same architecture holds across marketing, insights, customer success, and any industry where bad context is expensive.
Not the whole story of Applied AI – but a concrete one.
Framework 01
The architecture that makes it work.
The stack is read from the bottom up. Three foundational pillars feed a unified consumption layer. The consumption layer feeds the agent surface. The agent surface answers the people at the top.
TOP OF THE STACK
Users
Business analysts, decision-makers, team members. They ask questions, receive answers, and act on them.
LAYER 01
Agent Surface
Where users meet the system. Assistants, briefs, digests.
LAYER 02
Unified Consumption Layer
Orchestration. Per-hop confidence. Citation.
LAYER 03a
Knowledge Layer
Reads + connects the world.
RAG
Brand plans, content, research
Knowledge Graph
Customer → account → channel
LAYER 03b
Semantic Layer
Counts the world.
Governed metrics
One authority per KPI
Warehouse / sources
Sales, CRM, claims, transactions
LAYER 03c
Entity Resolution Spine
Identifies the world.
Canonical identity
One person across every source
Match accuracy threshold
95–99%
What this is not
Framework 02
Three modalities. One stitched answer.
Most AI implementations fail because they try to force an entire business into one data shape. Each modality has a specific job. Compose them and a single question pulls a complete answer without anyone hand-wiring it.
Tabular
Counts the world.
Governed numerical data through a strict semantic layer. The system that knows what TRx means before anyone runs a query.
Examples
- Sales, revenue, share, growth metrics
- CRM activity and territory data
- Claims, payer mix, formulary tier
RAG
Reads the world.
Vector embeddings over unstructured content. Lets the system retrieve the right document chunk for the right question.
Examples
- Brand plans, launch plans, strategy decks
- Approved messaging and field content
- Past research, transcripts, reports
Knowledge Graph
Connects the world.
Entities and the precise links between them. Models the ecosystem that the rows in a table cannot describe on their own.
Examples
- Customer → account → parent → subsidiary
- Product → contract → channel → partner
- KOL → trial → publication → institution
Framework 03
Six ways this fails. Six ways it doesn’t.
We’ve seen every pattern below in flight. The left is what we walk into. The right is what we leave behind.
Failure modes
- F01
Boiling the ocean
Trying to model every entity at once. Nothing ships.
- F02
Building before governance
Defining metrics in tools before defining them in policy.
- F03
Universal data model overreach
One master taxonomy that tries to be authoritative across the whole company. Never finishes.
- F04
Demos that don’t transfer
A working prototype with no methodology behind it. Shelf life: weeks.
- F05
Retrieval and structured semantics as separate workstreams
Different teams build them. They never compose.
- F06
Outsourcing without methodology transfer
Consultants leave with the muscle. Client is back to square one.
Success patterns
- S01
Right sequence
Governance → semantic → knowledge → consumption → agent. In that order.
- S02
Metric council before metric definitions
One authority owns what each metric means before anyone codes it.
- S03
Targeted scope with an extension protocol
Build for one use case. Extend with rules, not redesign.
- S04
Per-hop confidence as a day-one requirement
Every answer cites its sources and its confidence.
- S05
Methodology transfer alongside every deliverable
The artifact is the asset. The methodology is the muscle.
- S06
Push-based intelligence as the design target
Insights arrive at the decision-maker. Dashboards become a fallback.
Framework 04
Where the low-hanging fruit is.
Six places an AI agent can earn its keep today. The structure transfers to any vertical where data is regulated, distributed, and decisions are accountable.
Tabular + RAG
Strategic plan + deck generation
The problem
Quarterly business reviews are built from scratch every cycle. Performance numbers and strategic narrative live in separate worlds.
The approach
An agent stitches the plan, the strategic targets, and current performance. Output: a draft review that flags where performance diverges from the plan.
Knowledge Graph + RAG
Cross-silo research dedup
The problem
Multiple divisions commission overlapping studies. The fifth time a question gets fielded is the first time anyone notices.
The approach
A knowledge graph of past research plus retrieval over discussion guides. The agent answers “has this been done before” before a new RFP goes out.
Tabular + RAG + Knowledge Graph
Field-facing pre-call intelligence
The problem
Sales reps spend 20 minutes hunting context across dashboards, CRM, and files for a single conversation. Most of it never gets used.
The approach
A 90-second pre-call brief: performance, the right approved message, and the network context – composed into one answer.
Knowledge Graph
Web-of-definitions guardrails
The problem
The same metric is defined differently in three tools. Cross-tool queries silently merge the wrong things.
The approach
A shared graph of metric definitions with provenance. The system flags conflicts on cross-tool queries instead of hiding them.
RAG
SOW / RFP cross-silo dedup
The problem
Parallel divisions buy materially identical work from different vendors. Nobody sees the duplication until billing.
The approach
Retrieval over the SOW / RFP corpus. The agent flags “we are already paying for this.”
Tabular + RAG + Knowledge Graph
Pre-launch readiness intelligence
The problem
Awareness, landscape, content coverage, and channel coverage live in four separate workstreams. The readiness brief is hand-stitched.
The approach
A unified brief composed on the shared graph. One question, one answer, four workstreams behind it.
Framework 05
How a department restructures underneath.
An illustrative example using marketing. The same pattern repeats across any department where structured workflows run through a manager. The director stays human. The functional managers stay human. What changes is the layer underneath, where four to five specialists become one AI agent plus one human QA analyst per branch.
Before – today
17–25 humans
CMO
Lead Gen Manager
Events Manager
Content Manager
Social Manager
Lead Gen Team
3–5 specialists
Events Team
3–5 specialists
Content Team
3–5 specialists
Social Team
3–5 specialists
After
9 humans + 4 agents
CMO
Lead Gen Manager
Events Manager
Content Manager
Social Manager
Lead Gen Agent
QA Analyst
Events Agent
QA Analyst
Content Agent
QA Analyst
Social Agent
QA Analyst
The takeaway
You used to have a director, a row of managers, and a deep bench of specialists doing the work underneath. Tomorrow you still have the director, you still have the managers, but the specialists become a paired agent and QA analyst per branch. Same accountability. Same managerial layer. Less headcount doing the execution.
What changes for the people doing the work
The roles shift too.
Today
Analyst
Pulls data, builds slides, hands off to the next person.
Data engineer
Builds pipelines and warehouse logic. Owns the plumbing.
BI developer
Builds dashboards in whatever BI tool the org standardized on.
MR / Insights lead
Designs and runs primary research; reports findings up.
Tomorrow
Semantic Layer Translator
Business-fluent and technically literate. Translates questions into governed queries and authors new definitions when a gap is found.
Provenance & Confidence Engineer
Reliability engineering for the consumption layer. Owns per-hop confidence, citation validity, hallucination detection.
Decision-Intelligence Designer
Designs the weekly decision digest pattern. Cadence-design, not feature-design.
Data Storyteller / Insight Curator
Turns raw agent outputs into decision-ready briefings.
On tooling
Where BI tools fit. Where they don’t.
We are tool-agnostic. We do not resell platforms. That means our recommendations are not shaped by vendor relationships, and our defaults are chosen for the work.
When we use your existing BI stack
When your environment already standardizes on it.
If your analysts live in a BI tool and your governance runs through it, we meet you there. We build to the same standard we apply everywhere else, just rendered in your tool of choice.
What we ship by default
You own it. From data to dashboard, end to end.
The data never leaves your ecosystem. The warehouse, the semantic layer, the dashboards, the chatbot – all built inside your environment, hosted wherever you choose, and handed off as code you control.
- ✓Built within your security perimeter. Compliance-aligned from day one.
- ✓Self-contained dashboards. Single-file, hand-off ready.
- ✓The methodology travels with the artifact. Your team can extend it.
- ✓Stack: Self-contained HTML, Streamlit, DuckDB, Plotly, embedded chatbot.
The future is not a specific BI tool. The future is governed semantics that any surface can render, and an agent layer that doesn’t care which one.
Drink our own champagne
Two demos. One methodology.
Both demos run on dummy data. The architecture underneath does not. Each one is a full instance of how we’d build for a client – a data warehouse, a semantic layer, the dashboards, and the chatbot, sequenced and governed the same way every time.
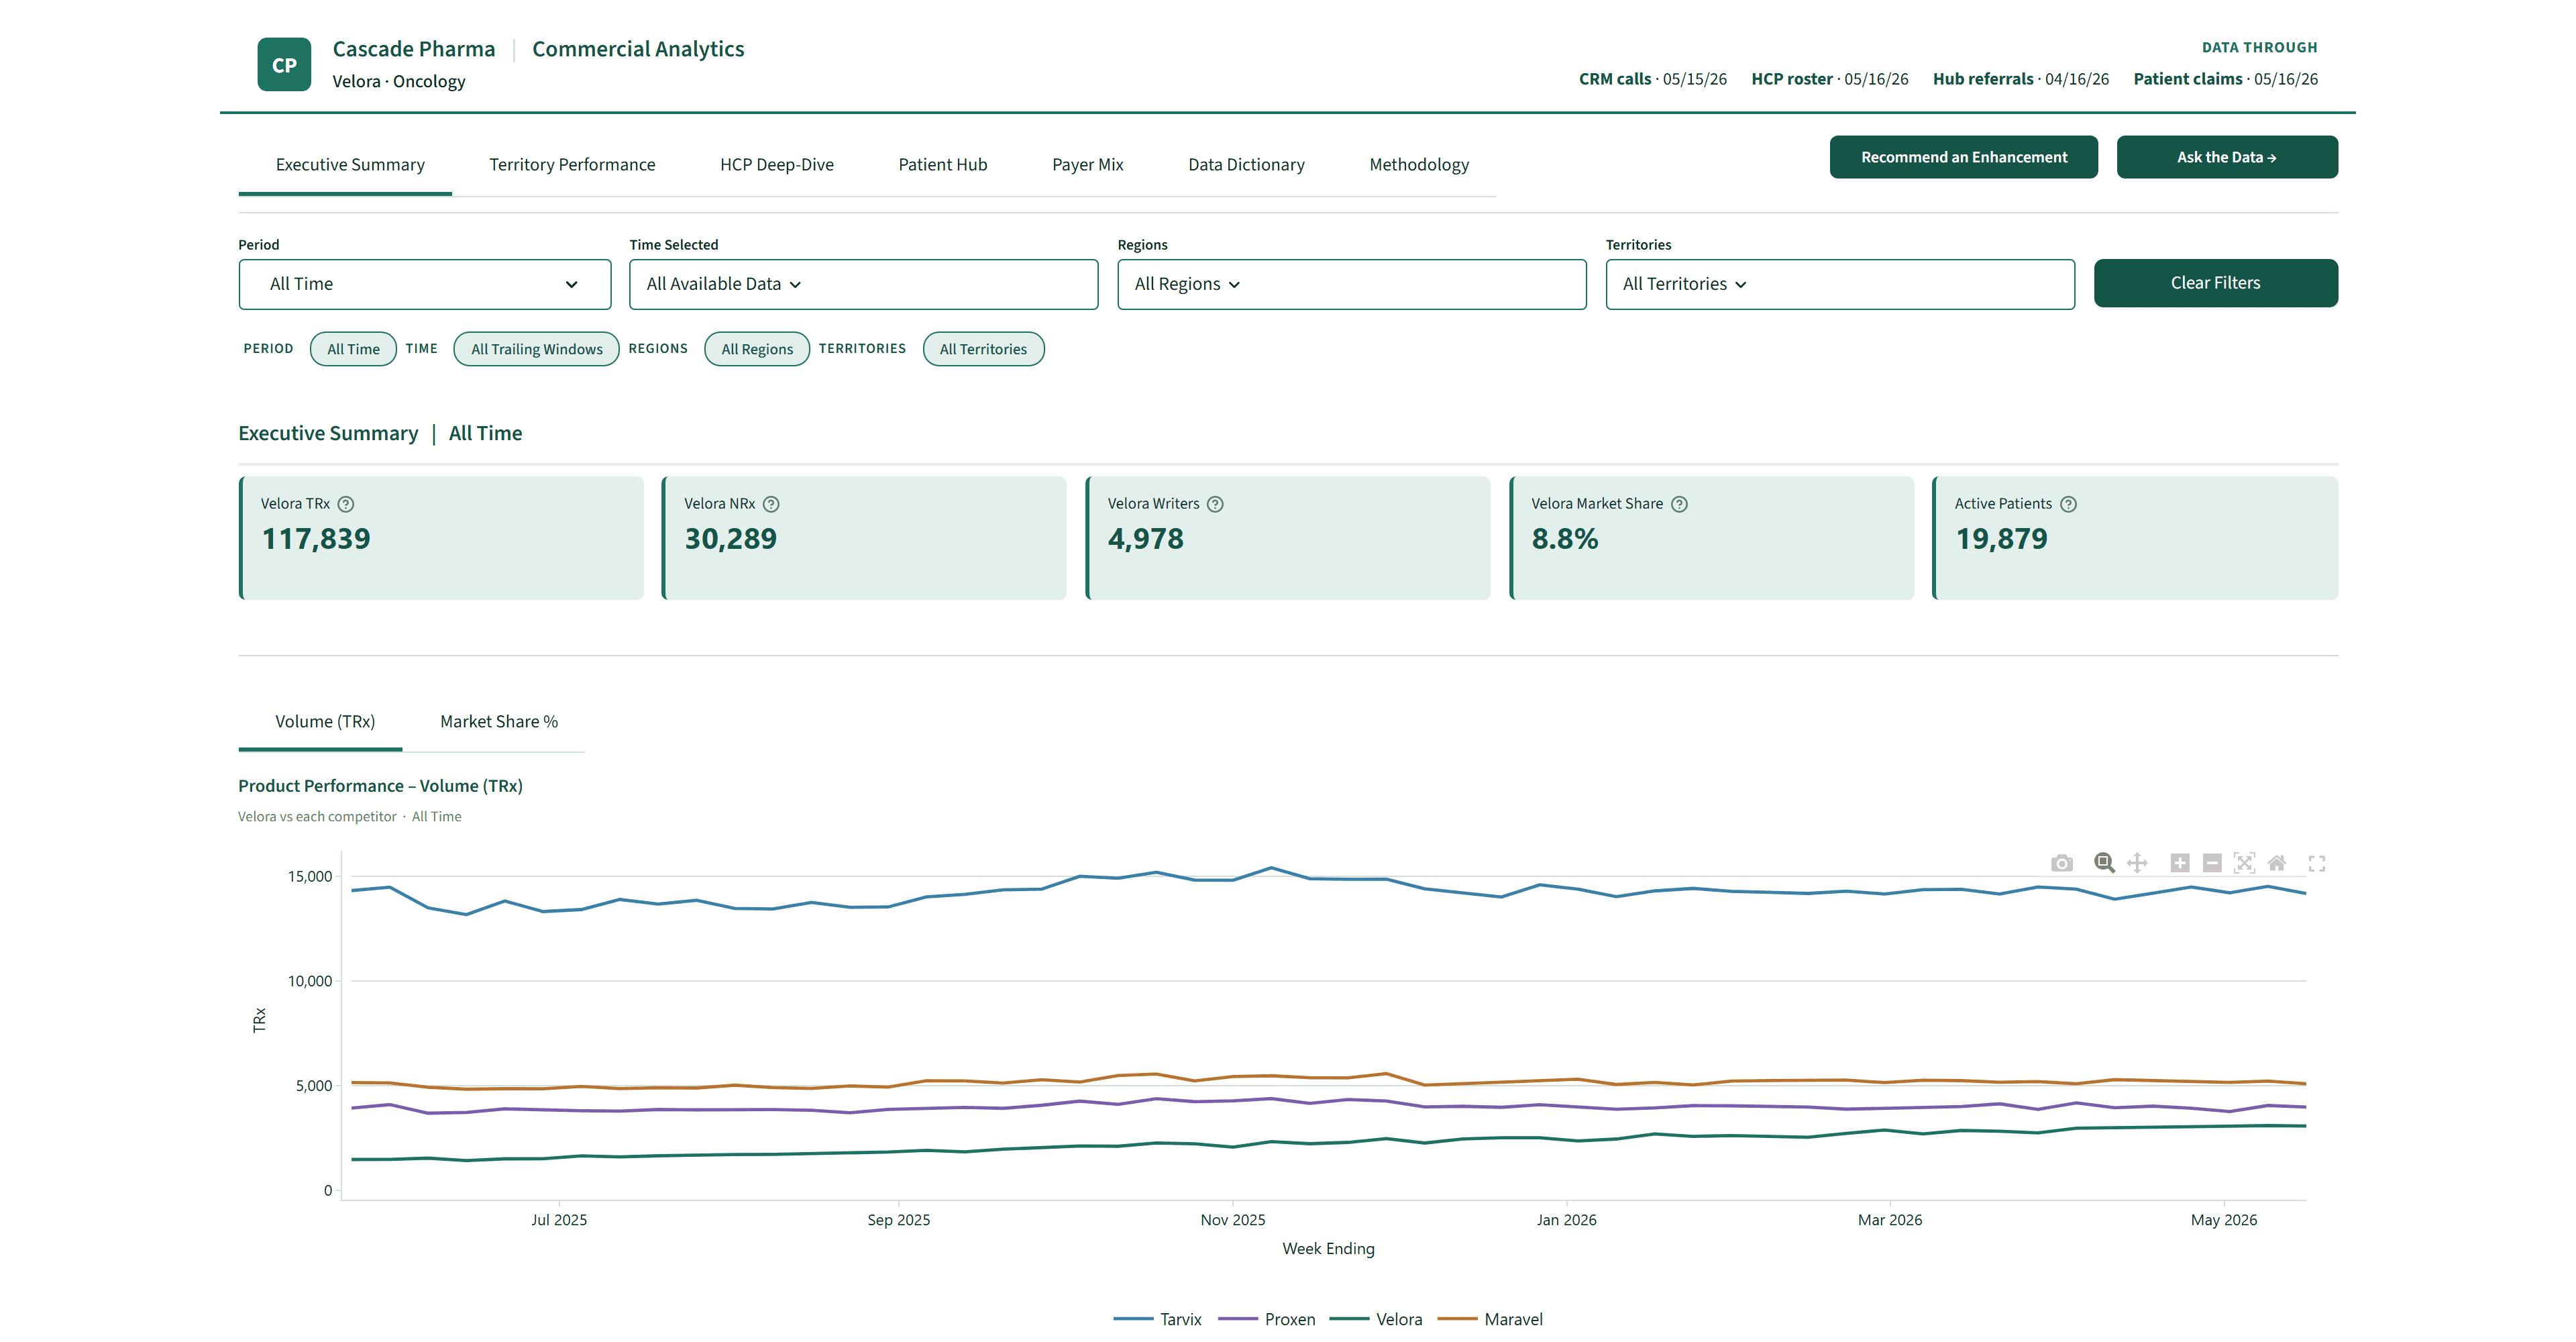
Analytics Demo
Commercial analytics dashboard built on a full Cascade Way warehouse: KPI tracking, territory performance, and an “Ask the Data” chatbot wired into the semantic layer.
Open live demo
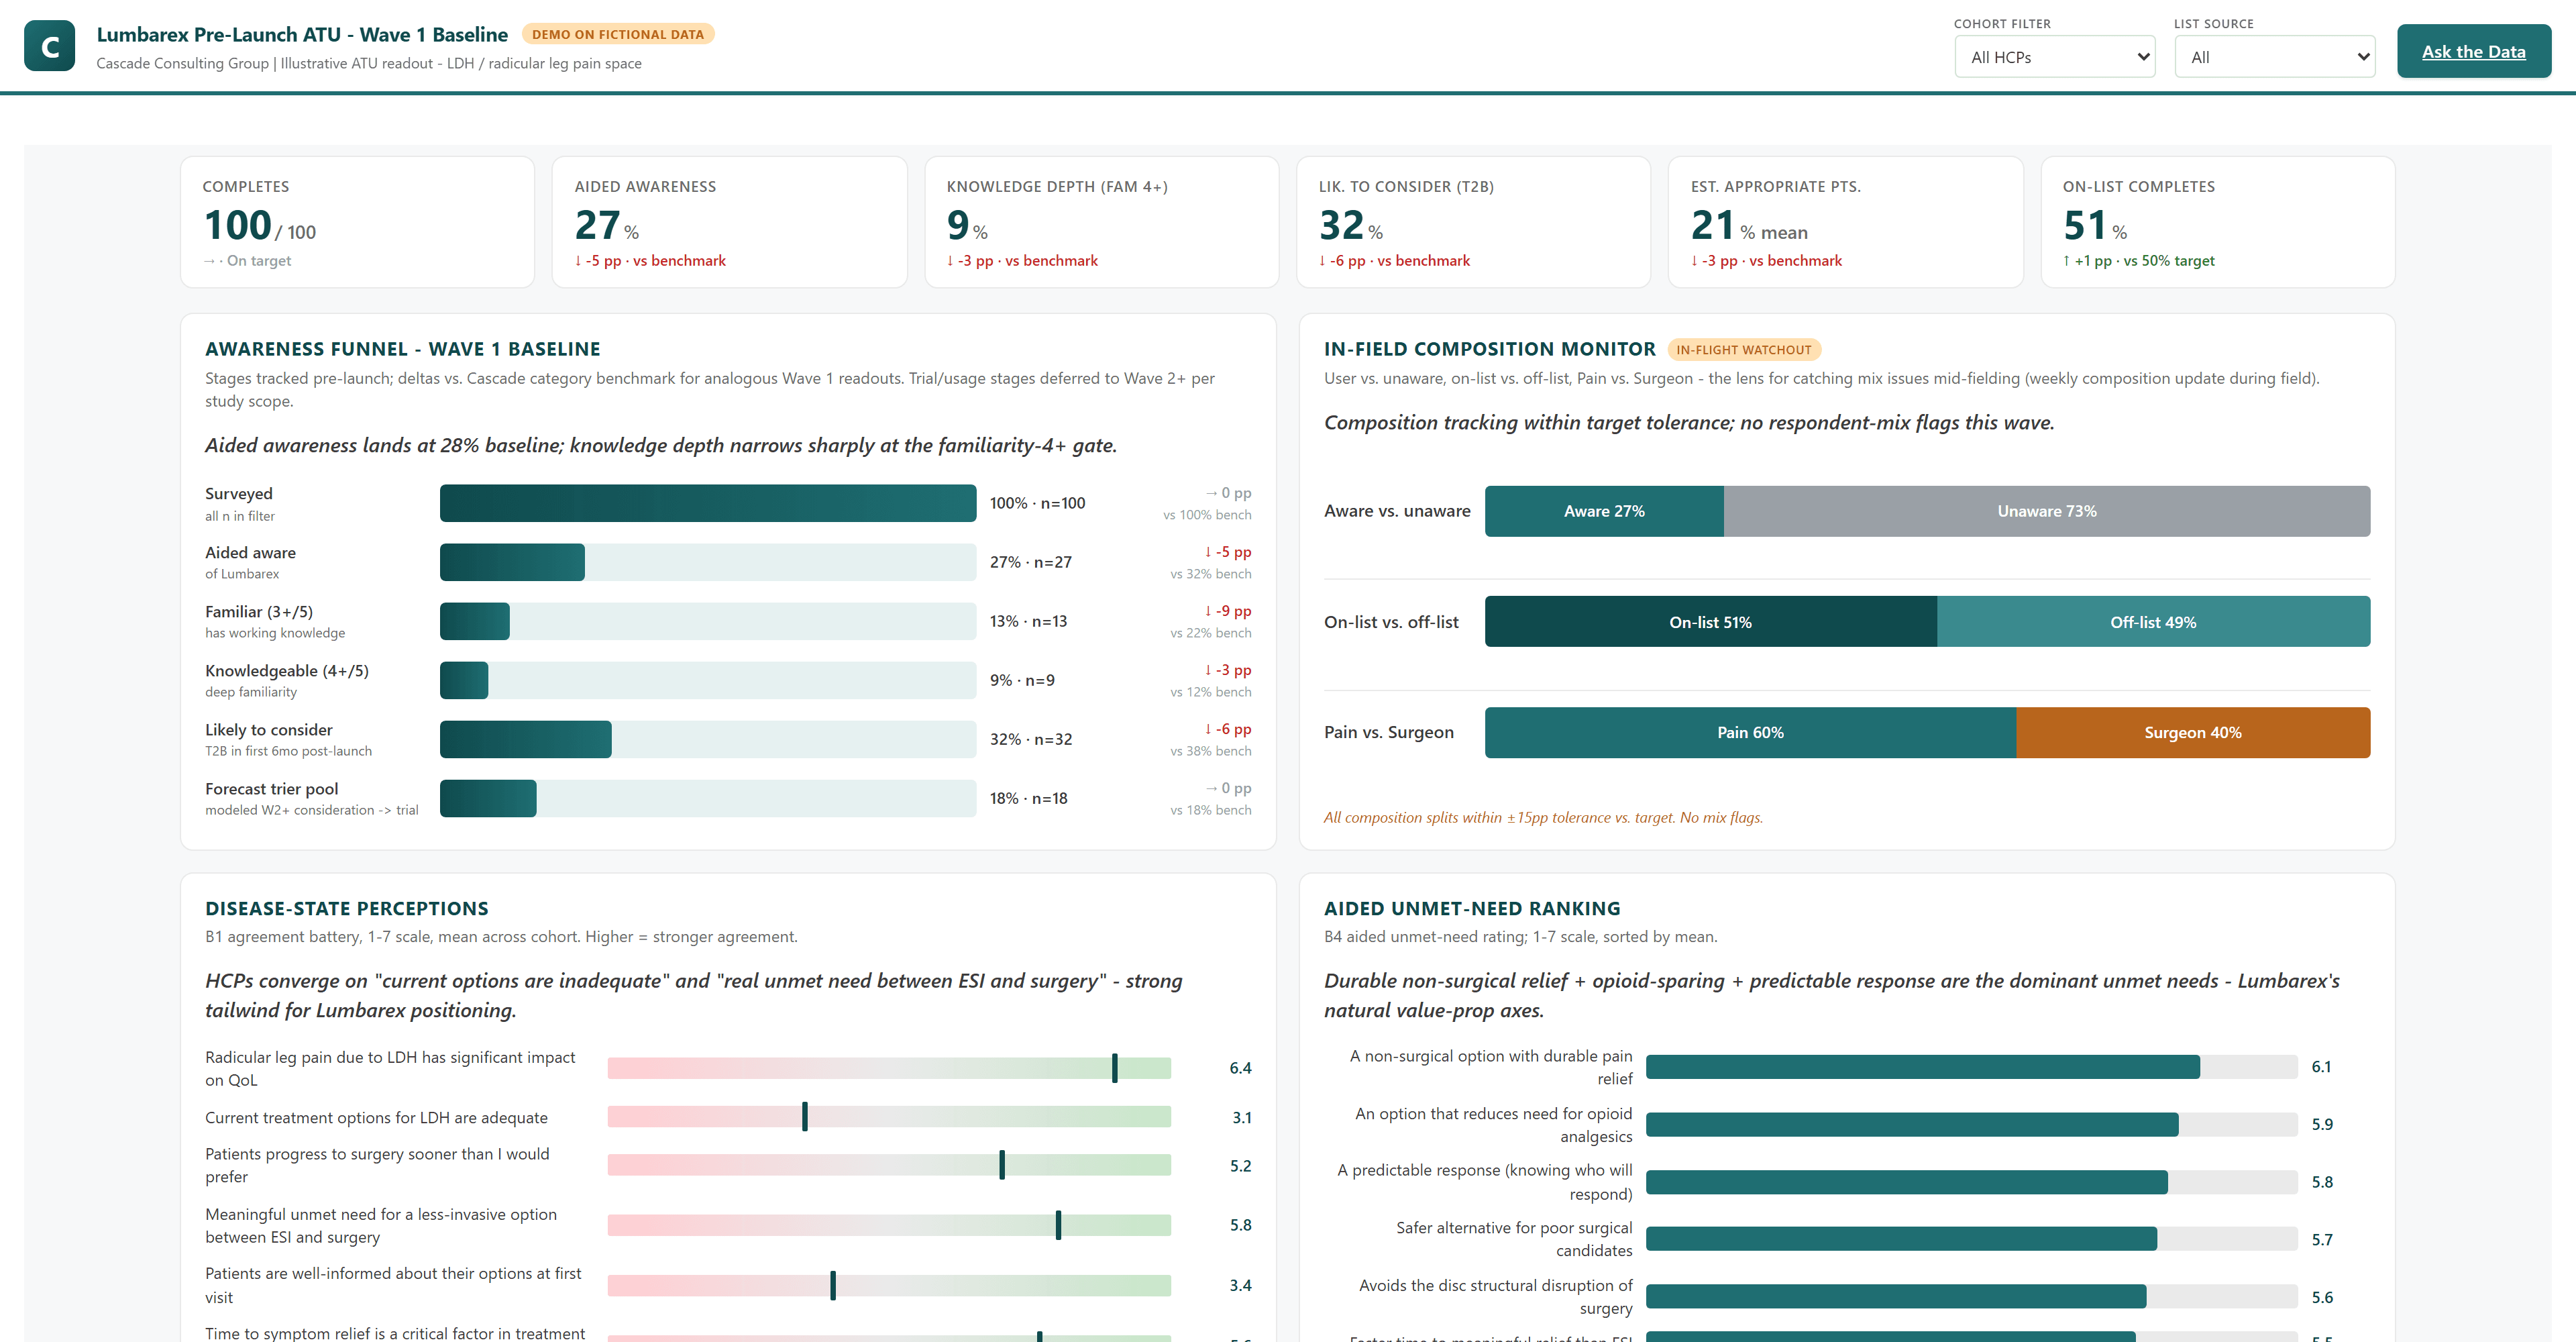
Market Research Demo
Pre-launch ATU tracker with in-flight composition monitoring, awareness funnel, and aided unmet-need ranking. Same methodology, different modality.
Open live demo
FYI: the demos are built for desktop and are not optimized for mobile devices.
Have an AI question that needs more than a demo?
If you're figuring out where to start, why a previous attempt didn't stick, or how to sequence the next 12 months, we'd like to hear about it.